 SurfaceCast: Surface Temp
SurfaceCast: Surface Temp
See how hot the ground actually gets — hour by hour, before you head out the door.
Download on the App Store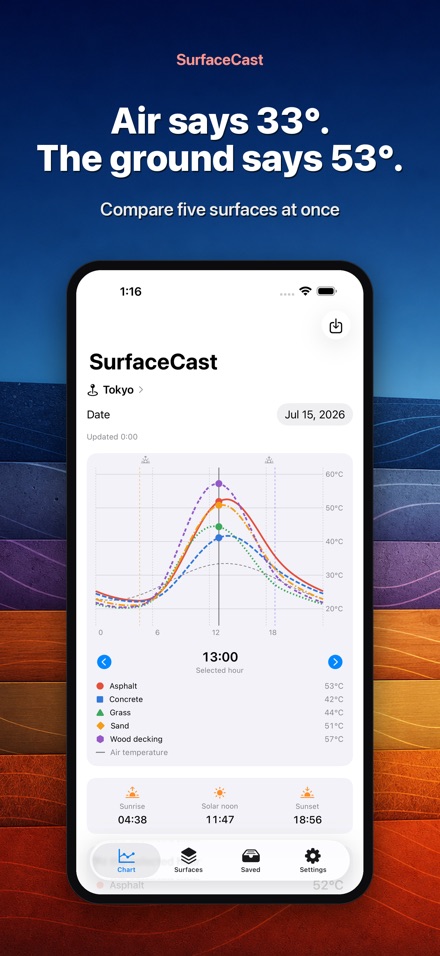
Screenshots
Features
Compare surfaces side by side
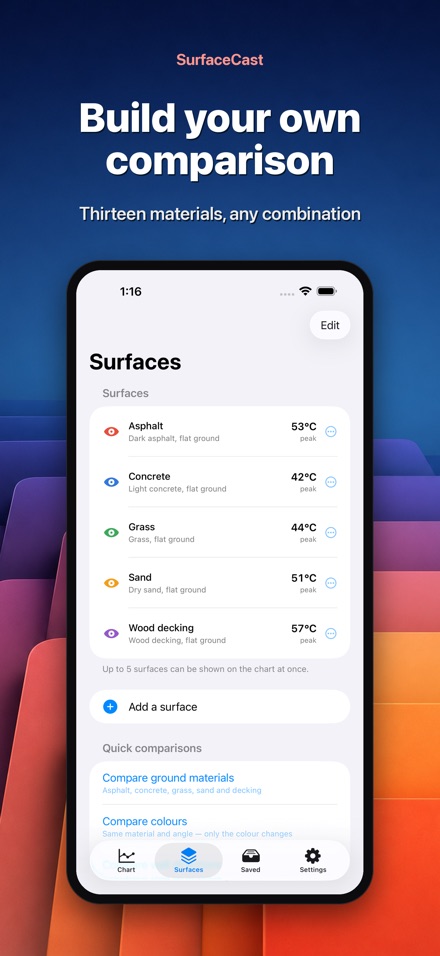
Put up to five surfaces on the one chart: bitumen, concrete, grass, bare soil, sand, timber decking, brick, painted metal, and light or dark walls. The gap between them is usually far wider than people expect.
Colour changes everything
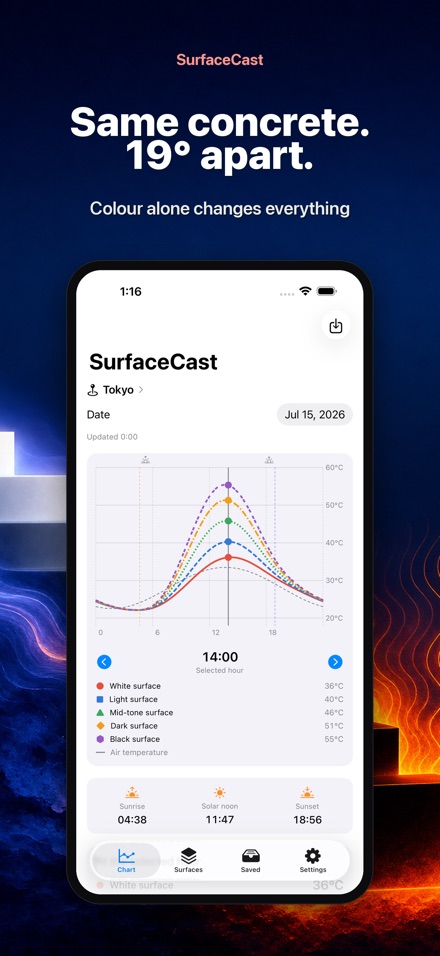
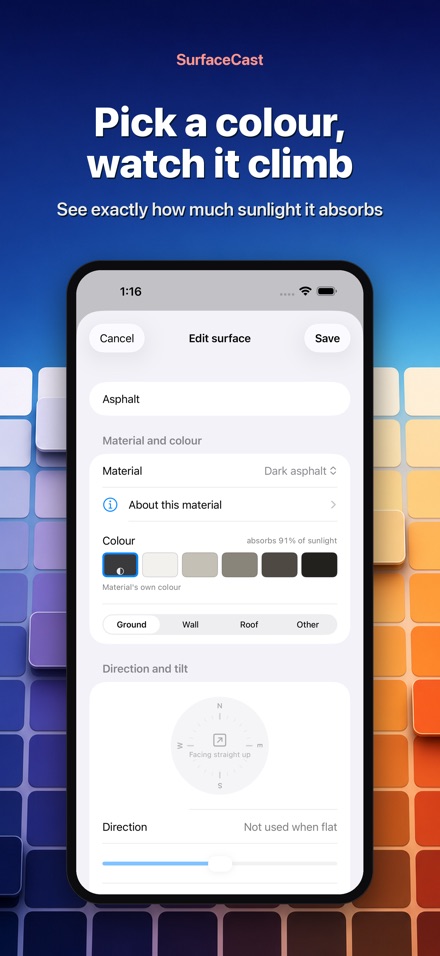
Keep the material, the orientation and the tilt identical, and change only the colour. On a clear summer day a white surface and a black one can sit around nineteen or twenty degrees apart. SurfaceCast shows exactly how much sunlight each shade absorbs.
Walls and roofs, not just the ground
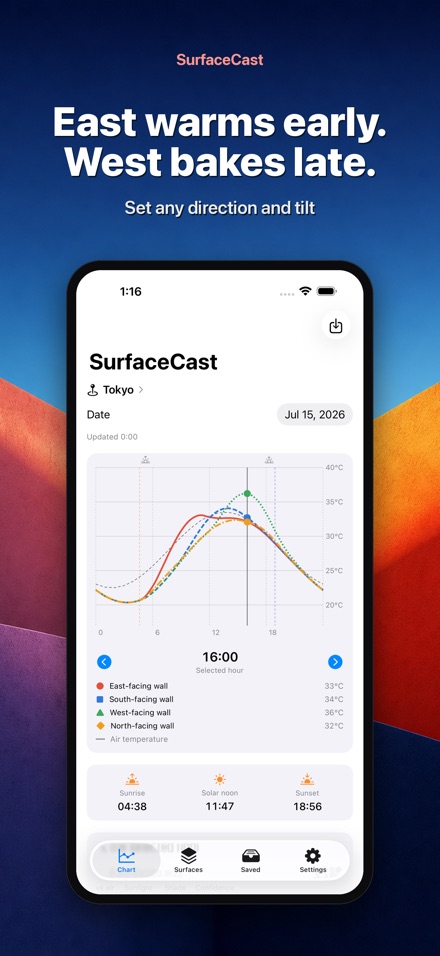
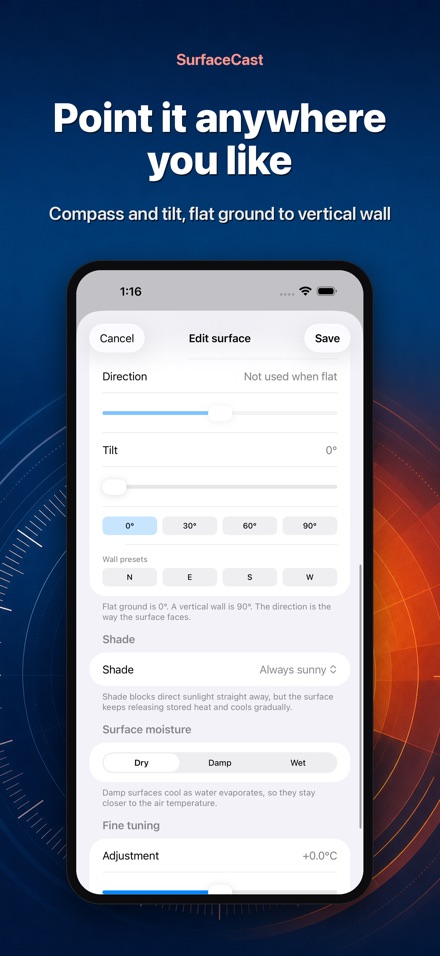
Every surface carries a compass direction and a tilt, from flat ground at 0° to a vertical wall at 90°. Point a wall east and it warms through the morning; point it west and it peaks late in the day. Down here it is the north-facing wall that collects the most sun, and the model works that out from your latitude.
Shade that behaves like real shade
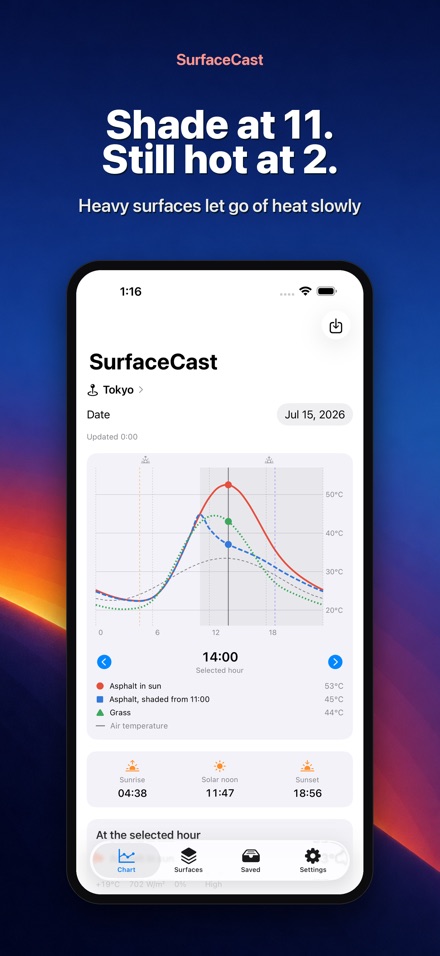
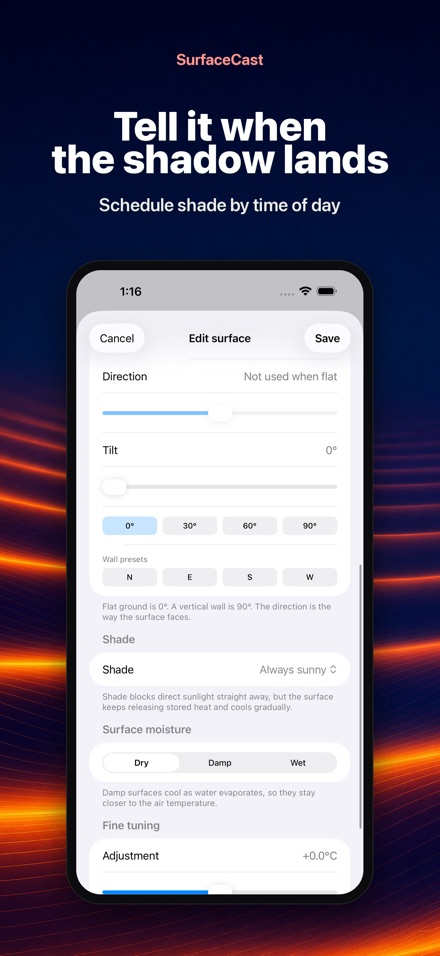
Mark the hours when a surface falls into shadow. Sunlight drops to zero straight away, but a heavy surface keeps releasing the heat it has stored and cools gradually — the lag you feel outdoors, modelled properly.
Read any hour in detail
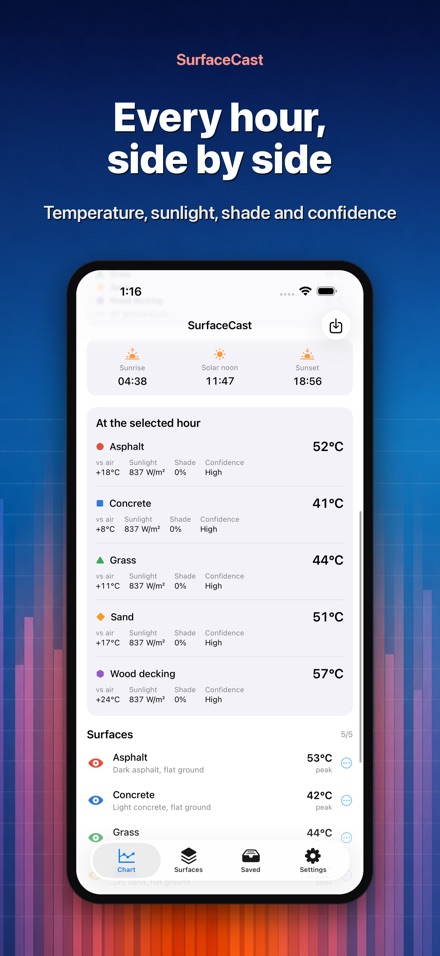
Tap an hour for a table showing each surface's estimated temperature, the difference from air temperature, the sunlight landing on that face, its shade level, and how confident the estimate is.
Save the places you check often
Store a set of surfaces under a name like “the back yard” or “the dog walk”, then reload it later with a new date. Works from a cached forecast when you are offline, in Celsius or Fahrenheit.
Air temperature tells you almost nothing about how hot the ground actually gets. On a clear January afternoon, dark bitumen can sit far above the air, while the grass a step away barely leaves it. SurfaceCast draws that difference as a curve, hour by hour, before you head out the door.
Pick a place and a date. From the real hourly forecast for that spot, the app estimates how a surface heats up and how it cools down across the day.
COMPARE MATERIALS
Dark bitumen, light concrete, dark concrete, grass, dry soil, damp soil, dry sand, timber decking, brick, light or dark painted metal, a white wall and a dark wall. Up to five scenarios on the one chart, so the gaps show up straight away.
CHANGE NOTHING BUT THE COLOUR
This is the experiment that surprises people most. Same material, same orientation, same tilt, and just shift the colour from white to black. In the middle of summer the gap can reach nineteen or twenty degrees. Useful when you are picking a roof colour, a rendered wall, a decking oil or the paving around a pool.
WALLS AND ROOFS, NOT JUST THE GROUND
Every surface carries a compass direction and a tilt, from 0° flat to 90° vertical. An east-facing wall warms through the morning; a west-facing one peaks late in the day. Four one-tap presets cover the north, east, south and west walls — and in the southern hemisphere it is the north-facing wall that collects the most sun, which the model works out from your latitude rather than assuming.
SHADE THAT BEHAVES LIKE REAL SHADE
Mark the hours a surface falls into shadow, say from 11:00 onwards. Sunlight drops to zero immediately, but the temperature does not: heavy materials give up their stored heat slowly and cool gradually. That lag is the whole point, and SurfaceCast models it rather than just switching the curve off.
WHAT YOU GET
• A 24-hour estimated surface temperature curve for up to five scenarios
• Hourly weather for your location, or anywhere you search for
• Air temperature overlaid as a dashed line, so the gap is easy to read
• Sunrise, solar noon and sunset markers, plus shaded bands on the chart
• Tap any hour for a side-by-side table: temperature, difference from the air, sunlight landing on that face, shade level and an estimate confidence
• Peak temperature and the time it happens, for every scenario
SAVE YOUR SETS
Store a place and its surfaces under a name of your own — "the backyard", "the dog walk", "the shed roof" — then reload the lot on another date.
WHO IT IS FOR
Sizing up the footpath before the dog goes out, kids playing outside, gardening and pots on the verandah, DIY before you commit to a colour, students and professionals in architecture, landscaping and civil works, photographers scouting a location, camping trips, and anyone curious about how hot a city gets.
HOW IT WORKS
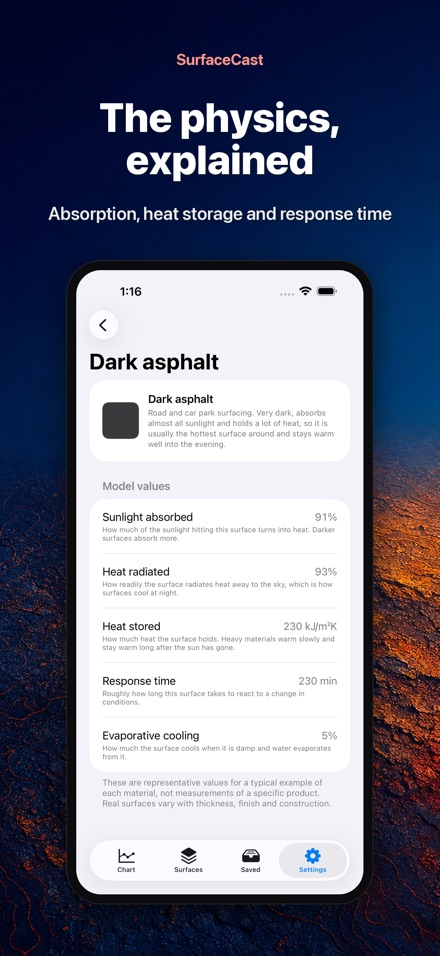
SurfaceCast computes the sun's position for your place and time, works out how much sunlight reaches a face at that tilt and direction, then runs a heat balance in short internal steps: sunlight absorbed, heat carried off by the wind, heat radiated to the sky, heat exchanged with the ground below, and evaporative cooling on damp surfaces. Every material brings its own absorptivity, emissivity and thermal mass, so heavy and light surfaces behave differently, as they should. The previous 24 hours run first as a warm-up, so the starting value does not skew the day you are looking at.
ALSO
Celsius or Fahrenheit, works offline from the last saved forecast, no further purchases. iPhone and iPad.
PLEASE NOTE
Every figure is a physics-based estimate, meant for observation, learning and curiosity. Real surfaces vary with thickness, construction, moisture, reflections off nearby buildings, local wind and the exact shape of the shadow. SurfaceCast is not a measuring instrument and does not judge whether a surface is safe to touch or walk on. When that matters, measure it with an infrared thermometer.